Individual Subscription – One Year – $200
Institutional Subscription – One Year – $750
(Includes access to the withholding-tax data series.)
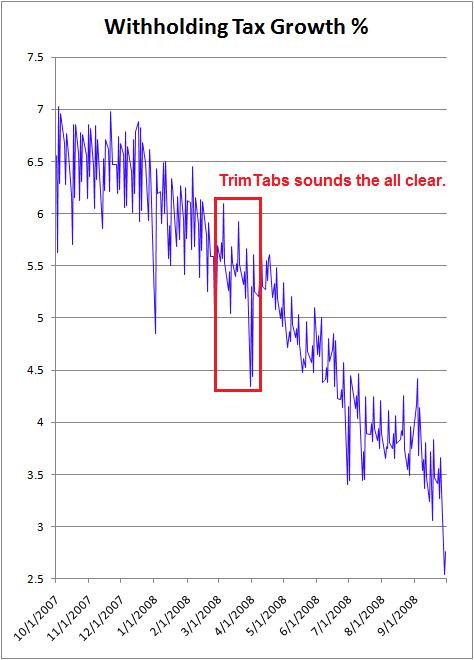
The withholding data is also available from research firm, TrimTabs. However, they charge thousands of dollars, and don’t have anything close to the charts that we have here. And while we provide truly objective charts using nothing but the raw data, as well as a parallel series of charts adjusted for tax cuts, TrimTabs takes a more “impressionistic” approach. For example, in March of 2008, TrimTabs proclaimed the recession to be over. Read the MarketWatch story.
Can you believe that? TrimTabs sounded the “all clear” just as the economy was about to go over the cliff in historic fashion. TrimTabs based this judgment upon the fact that “withholdings during March were 4.1% higher than one year ago.” And while that was strictly true, it was obvious that the trajectory was pointing downward for anybody who studied the data. The red box on this chart shows the period in question:

So, while TrimTabs reported a ballbark number of 4.1% growth, it was a horrificaly bad interpretation of the situation. Growth had clearly peaked several months prior, and the withholding data was actually screaming “contraction” rather than signaling recovery.
During the Summer of 2009, Larry Kudlow had Deutsche Bank chief economist Joe Lavorgna on his CNBC television show “The Kudlow Report” several times. Each time Lavorgna predicted an upside surprise showing job-creation in the BLS’s “Employment Situation” report. Lavorgna got it wrong every time. If he had been looking at the withholding data, he would have known that there was nothing good happening. Instead, he chose to follow his dogma about how “every economic cycle” evolves. Historically, jobs would indeed snap right back as the economy came out of a recession, but things played out differently in 2009. A positive (un-revised) number wasn’t reported until April 2, 2010.
The moral of the story is that the second-derivative analysis of the withholding tax data that we do here is the most powerful method of analyzing the growth of the US economy. It is far superior to the methods of even the best economists, and simply not available anywhere else.
You get quite a lot of bang-for-your-buck here at DailyJobsUpdate.com.